1.6 KiB
| title |
|---|
| Monitoring with Ethstats |
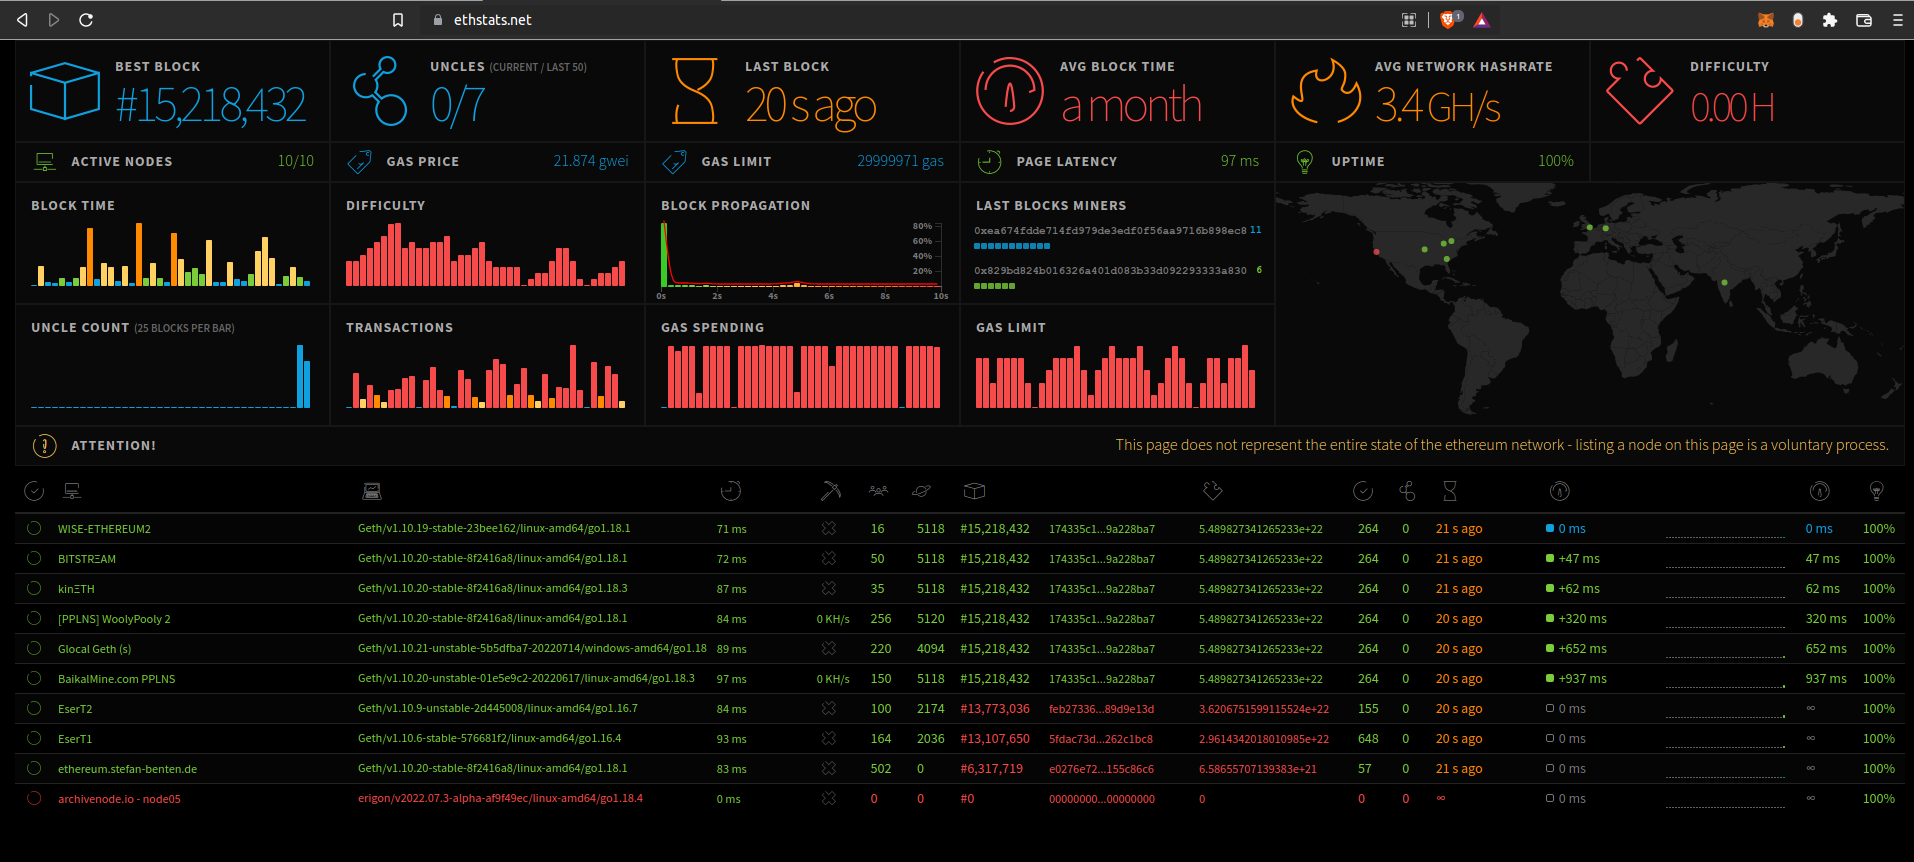
Ethstats is a service that displays real time and historical statistics about individual nodes connected to a network and about the network itself. Individual node statistics include the last received block, block time, propagation time, connected peers, latency etc. Network metrics include the number of nodes, average block times, node geolocation, transaction counts etc.
These statistics are presented to the user in the form of a dashboard served to a web browser. This can be configured using the public Ethstats server for Ethereum mainnet or some public testnets, or using a local copy of Ethstats for private networks. This page will demonstrate how to set up an Ethstats dashboard for private and public networks.
Prerequisites
To follow the instructions on this page the following are required:
- Geth
- Node
- NPM
- Git
Ethstats
Ethstats has three components:
- a server that consumes data sent to it by each individual node on a network and serves statistics generated from that data.
- a client that queries a node and sends its data to the server
- a dashboard that displays the statistics generated by the server
The summary dashboard for Ethereum Mainnet can be viewed at ethstats.net.
Note that the Ethstats dashboard is not a reliable source of information about the entire Ethereum network because submitting data to the Ethstats server is voluntary and has to be configured by individual nodes. Therefore, many nodes are omitted from the summary statistics.
.. UNFINISHED
Reporting URL of a ethstats service (nodename:secret@host:port)
